
Imefadhiliwa
Nairobi, Nairobi Kati, siku 1 zilizopita
3 maoni
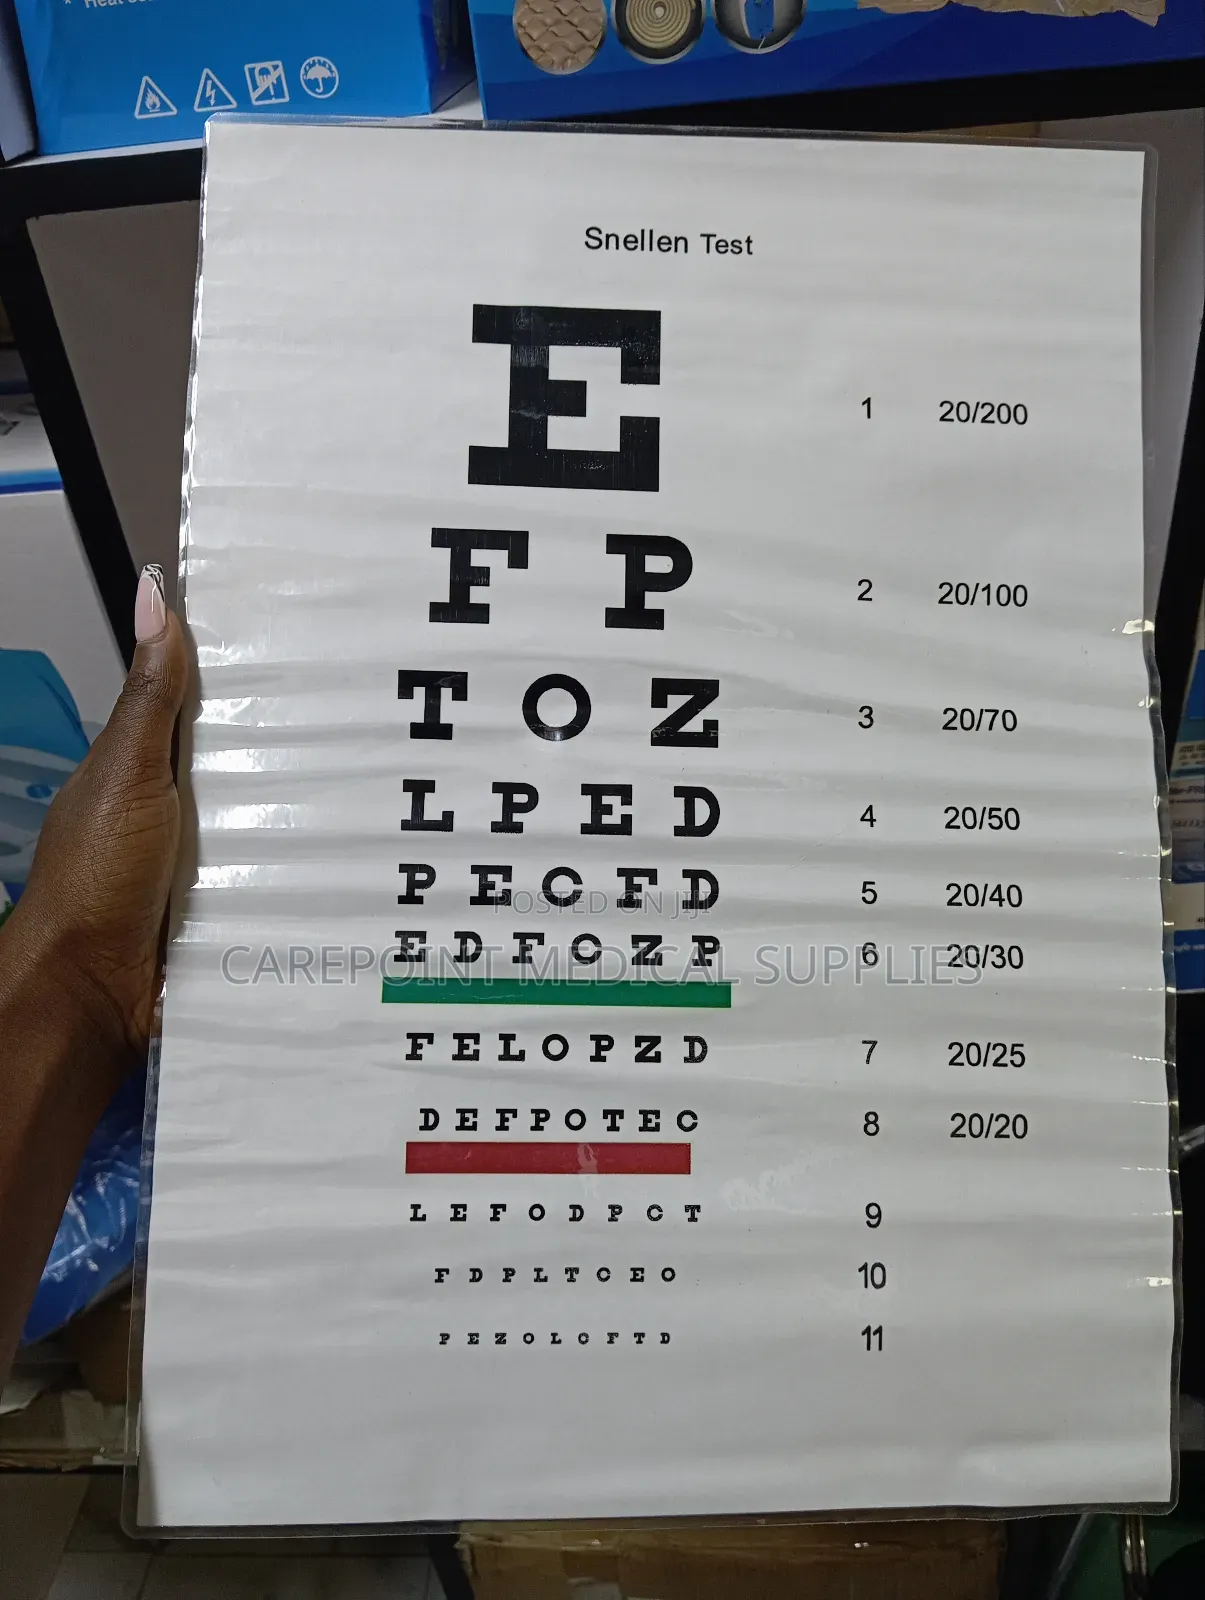
Snail Chart
Vifaa vya daktari wa macho
Aina
Chapa Mpya
Hali
Chati ya Mtihani
Vifaa vya daktari wa macho
Anwani ya duka
Nairobi • Nairobi Kati
Mfangano street Travis house 3rd floor A6 the building with quickmart supermarket near afya centre.
Travis house 3rd floor room A6
Closed
• Jumatatu - Jumamosi, 09:00-18:00
A snail chart is a type of chart that visualizes data using a spiral or winding path, similar to a snail's shell, and is used in data visualization. It's an alternative to traditional bar charts, especially for illustrating comparisons over time or stages.
KSh 1,500
Vidokezo vya Usalama
- Usilipe mapema hata kama ni ada ya kusafirishiwa bidhaa
- Kutana na muuzaji mahali salama pa umma
- Kagua kipengee na uhakikishe ni nini hasa unachotaka
- Hakikisha kwamba bidhaa uliyofungiwa ni ile ambayo uliagiza
- Lipa tu ikiwa umeridhika


